More often than not, when Javascript developers try to debug their code, the de facto method would be using console.log() as it is simple and straight to the point. It will just print out the anything that has being passed in. Through console.log(), we could identify the state of the variables, whether they are a number type, an object type or undefined.
After that, developers would be complacent about their current debugging technique with console.log and being totally ignorant about the existence of other incredibly useful console methods.
Debugging
There are a couple of console methods that can be utilized for a more effective debugging other than just console.log, which are console.assert, console.table, console.groupCollapsed, console.dir, console.trace and console.count.
Assert
The method to assert the expression passed in are truthy, else it will log out the error message that it has been given as the second parameter.
console.assert(1 === 1, '1 is not equal to 1')Table
The method to display any data that can be tabulated including array, object and multi-dimensional array.
var people = [
  ['John', 'Smith'],
  ['Jane', 'Doe'],
  ['Emily', 'Jones'],
]
console.table(people)
The output table are as follows.
| index | 0 | 1 |
|---|---|---|
| 0 | "John" | "Smith" |
| 1 | "Jane" | "Doe" |
| 2 | "Emily" | "Jones" |
Group Collapsed
Group collapsed is a method to start a section of structured console loggings in the console, with subsequent console calls grouped under the parent umbrella until console.groupEnd is called.
console.groupCollapsed('Mysterious Errors')
console.log("Console.log won't work")
console.log('Mom pls help')
console.groupEnd()
The logs are grouped nicely with an accordion to expand or collapse the underlying details.

The group can be nested as well by creating sub groups. It is required to end the group by calling groupEnd() accordingly.
console.group('Parent Group')
console.log('Parent log - 1')
console.group('Child Group')
console.log('Child log - 1')
console.log('Child log - 2')
console.groupEnd()
console.groupEnd()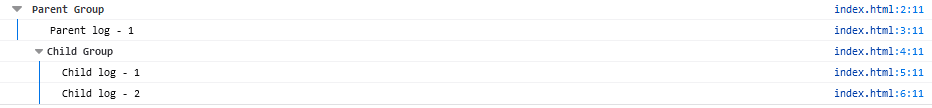
Dir
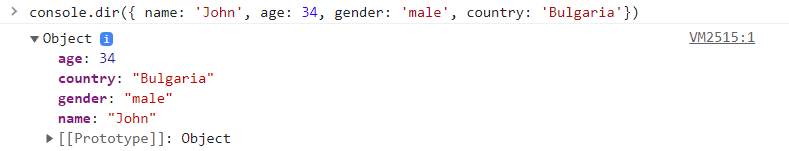
Provides a better readability for object types when logged. Outputs JSON info when html elements (with document.querySelector or methods akin) was passed.
Trace
Prints the stack trace to the console. Useful to trace the calls in nested functions.
Count
A counter that logs and increment by one each time it is being invoked. Useful for detecting multiple duplicated calls on a piece of code that suppose to only run once. It may be labelled with a string passed into the parameter.
console.count() // 1
console.count() // 2

// Labelled count
console.count('myLabel') // 1

// Resets
console.countReset() // Reset `default` label
console.countReset('myLabel') // Reset `myLabel` labelLevel
Gives the logs a level that can be used to distinguish its intention or urgency.
// Appear in blue color
console.info('This is debug message')

// Appear in yellow color
console.warn('This is warning message')

// Appear in red color
console.error('This is error message')

// Appear to be traceable
console.debug('This is debug message')| Level | Description | |
|---|---|---|
| 1. | Info | General messages, such as service start/stop, feature invoked etc. |
| 2. | Warn | Potential breaking behaviour such as missing arguments. |
| 3. | Error | Any behaviour that is fatal and impedes the operation to continue. |
| 4. | Debug | Provide diagnostic info that is helpful to others. |
Benchmarking
Timer
To benchmark a function call or the whole execution time of a feature, the time function allows us to start a timer when it is being called. Somewhere in the middle of the code, we can check the time elapsed since the timer started with console.timeLog(). The timer will need to be ended with the call to console.timeEnd() to reset the timer.
// starting the timer
console.time()

// execute some codes

// log time elapsed in the middle of code execution
console.timeLog()

// end timer
console.timeEnd()
Read more at MDN Docs about timer.
Profiler
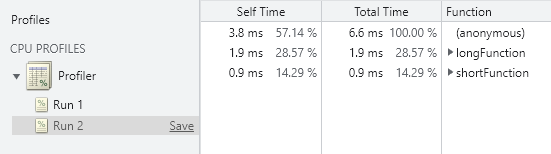
The console.profile is used to profile code execution performance with the JavaScript Profiler tool available in Google Chrome browser.
function shortFunction() {
  let number = 1
  number++
  console.log(number)
}

function longFunction() {
  for (let i = 0; i < 100000; i++);
}

console.profile('Profiler')
shortFunction()
console.timeStamp('Profiler')
longFunction()
console.profileEnd('Profiler')
The code above registers a profiling activity named Profiler and can be inspected in the DevTools under JavaScript Profiler.
Summary
Below are the summary of the aforementioned methods:
| Method | Description | Signature |
|---|---|---|
| Assert | Assert that the expression passed are truthy | console.assert(1 === 1, "1 is not equal to 1") |
| Table | Displays tabular data as a table | console.table(array1) |
| Group Collapsed | Creates a collapsed group that collects console commands | console.groupCollapsed('XHR Related Errors') |
| Dir | Logs all the properties of an object | console.dir(object) |
| Trace | Trace upon the entire call stack | console.trace() |
| Count | Increment the counter of a given label each time it is called | console.count(label) |
| Time | Start a timer | console.time() |
| Profiler | Start a profiling session in Chrome | console.profile(label) |
Styling
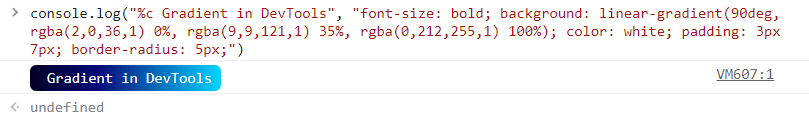
Here is a pro tip for the console.log fanatics. The logging in the browser (not Node.js) can be enhanced with different CSS stylings to make the log looks much better than the default one. To do that, add %c with a whitespace followed by the content to log, followed by a string of CSS related styles, separated by semicolons between the styles.
console.log(
  '%c Gradient in DevTools',
  'font-size: bold; background: linear-gradient(90deg, rgba(2,0,36,1) 0%, rgba(9,9,121,1) 35%, rgba(0,212,255,1) 100%); color: white; padding: 3px 7px; border-radius: 5px;'
)
Results in the following awesome looking console.
To provide multiple different stylings for one single log can be achieved by specifying more %c characters. They are essentially indicating where does the style would start from. If the interpreter encounters a second %c in one single log, the first applied style will stop there and begin to style the following with the second styles string provided.
The following example will demonstrate what was discussed above.
console.log(
  `%c Notice: %c The value for ${type} does not exist`,
  'color: white; background: #00d1b2; font-weight: bold; border-radius: 2px; ',
  'color: #00947e; background: #ebfffc;'
)
The above log takes in the string to be logged as its first parameter and taking two string of styles subsequently. It will yield the following when called.
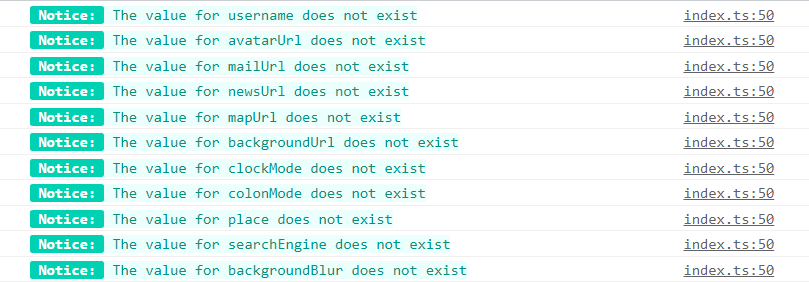
This is how to over-engineer the console.log and make it appealing as I did with one of my project.